Create batches
You create batches to populate the reporting database. Every eight hours, the ETL processes a batch and extracts information from the previous eight-hour window. The main types of batches match the primary data types (Performance, Model, and Event).
Existing batches and associated status information appear in the batch list. To access the batch list, choose Reports > Configuration from the Resource Manager browser interface. The batch list appears.
The list shows each batch and its status: UNSTARTED, CONFIGURING, READY, EXTRACTING, STAGING, FAILED, COMPLETED, or CANCELLED. The CANCELLED state occurs when the collector goes offline for a long period of time. Note: The CONFIGURING and READY states are currently only valid for Performance batches.
In general, you do not need to create manual batches. The only reason a manual batch should be created is as a result of a previous failed scheduled batch.
To add a manual batch:
-
From the batch list, click Add Batches and make selections as follows:
- Extractor - Choose MODEL, EVENTS, or PERFORMANCE. This process may take a few minutes after you connect the Resource Manager to the Analytics server and update the hubs and collectors.
- Begin Date - Optionally adjust the begin date and time. By default, the value is set to two weeks before the current Analytics server date and time.
-
End Date - Optionally adjust the end date and time. By default, the value is set to the current Analytics server date and time.
Note: Creating a batch that finishes in the future leaves a batch with a status of UNSTARTED. The batch will not start until that future date. Setting dates for MODEL is ignored; you will just get the current model.
-
Click Submit. The batch is added to the batch list.
Configuring repeat intervals
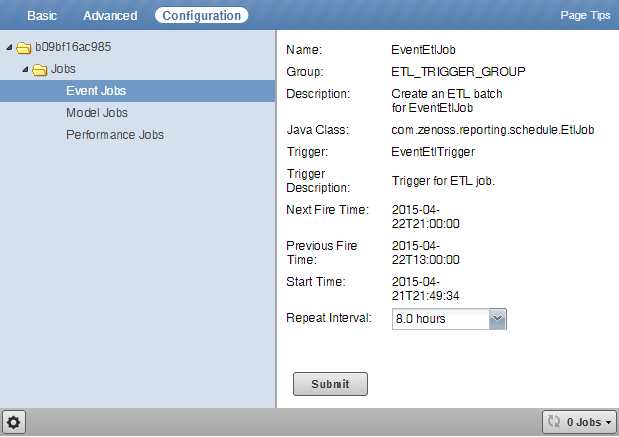
When configuring batch intervals (in Resource Manager), you must set an Analytics repeat interval for each Analytics server (rather than for each Resource Manager instance). This means that the same Analytics repeat interval setting will appear across Resource Manager instances.
You can configure repeat intervals separately for each extractor type. The default values are:
- Event Jobs - 8 hours
- Model Jobs - 24 hours
- Performance Jobs - 2 hours
To edit the repeat interval:
-
Expand the Jobs folder, and then select one of the extractor types.
-
Select a repeat interval (.25 hours to 24 hours), and then click Submit.
Filtering performance batches to a list of metrics
When you schedule a batch for a collector, all aliases that are present for the devices being monitored are extracted. If you want to add a new alias to an existing batch at a later date, you will only get future data when the scheduled batches are run. To collect past data, you need to create a filtered list of metrics to collect the past data. The following workflow should be used when adding a new alias to an existing scheduled batch:
- Add the new alias in ZODB. See Export data point data by creating aliases.
- Extract one batch normally, or wait for the next scheduled performance extraction to complete. This ensures that the future batches will contain the new metric and that Analytics has registered the new metric.
- Create a new manual batch to collect past data for the new metric by inserting the metric names into the meta_batch_metric_assoc table.
Setting a delay on performance batches
A configuration option for the zenperfetl daemon allows you to delay the execution of a performance batch until it reaches a specified amount of time into the past. This defaults to fifteen minutes and should not be changed without consulting Zenoss Support.
To change the value of the delay on performance batches:
-
Log in to the Control Center master host as a user with sudo privileges.
-
Attach to the zenperfetl service.
serviced service attach zenperfetl -
Change to the opt/zenoss/etc directory.
cd opt/zenoss/etc -
Open zenperfconfigetl.conf in an editor and uncomment the line containing the setting for batch-delay and set it to the value you want (in minutes).
Parallelization of performance loads
To increase loading of performance data, a new configuration has been added which loads performance data in parallel. Based on your I/O performance, you may want to increase or decrease the default number of performance threads that Analytics uses. The default value is 10, which is the equivalent of 5 cores.
To change the value, you must edit the meta_setting table directly:
-
Log in to the Analytics data warehouse database as the root user or a user with administrative permissions.
mysql -u root reporting -
Enter the following to lower the concurrent_threads to a value of 6. (If you want to increase parallelization, set the value to 12.)
update meta_setting set setting_value = '6' where setting_name = 'concurrent_threads';

