Storage Utilization vs Capacity
A summary of the total storage utilization compared with capacity for each storage device. Each device has its own group of graphs and may display some of the following information: Storage Utilization, Bytes Per Cycle, Managed Space Usage, Time Utilization, Data Throughput, Raw Space Usage, Datastore IO Rate, and Datastore IO Disk Usage. The graphs display both the current utilization and capacity along with projected values all on the same graph. Use the following report parameters to filter the report to the devices and type of information you are most interested in.
Report filtering
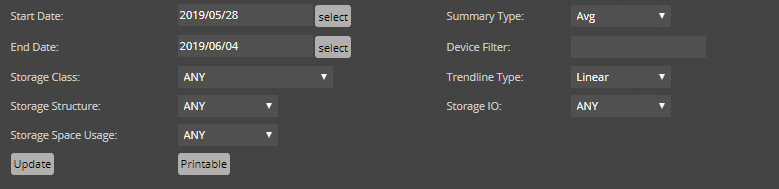
The following fields filter the results.
Start Date / End Date
The first and last dates of the range of dates to include in the report. To select a date from a calendar, click select. The default range is the week ending with the current date.
Summary Type
The type of summary that is to be displayed. Average is based on the 15-minute data collection, while Max is only taken once a day.
Device Filter
A substring search of devices to include. A partial name matches all interface names that include it. You may also use a regular expression for this filter.
Storage Class
Select the storage device class to filter by. You can select all devices class by selecting ANY.
Trendline Type
The calculation used to determine the trendline. Only available selection is Linear.
Storage Structure
Type of storage structure. Choose from ANY, Disk or Inodes.
Storage IO
Type of storage process. Choose from ANY, Read or Write.
Storage Space Usage
Type of storage space usage. Choose from ANY, Total, Used, Subscribed, Managed, Uncommitted, Raw, or Capacity.
To generate or refresh the report, click Update.