How to integrate Analytics and Resource Manager
Once the Analytics and database server host is installed, you are ready to integrate Analytics and Resource Manager.
Install the ZenETL ZenPack
Download the ZenETL ZenPack from delivery.zenoss.io and then follow the standard ZenPack installation procedure to install it.
Enhance performance data extraction
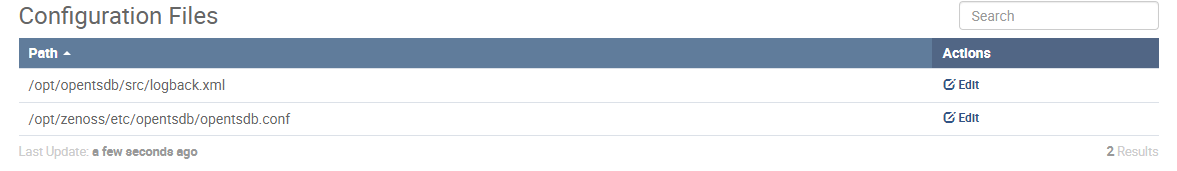
To speed up the extraction of performance data, update the Infrastructure > opentsdb > reader service.
-
Log in to the Control Center browser interface.
-
Navigate to Infrastructure > opentsdb > reader.
-
Edit the opentsdb.conf file.
-
Set
tsd.query.skip_unresolved_tagvstoTrue. -
Save the configuration file.
-
Log in to the Control Center master host as root or as a user with superuser privileges.
-
Stop Resource Manager services.
serviced service stop Zenoss.resmgr -
Wait until all services are stopped.
serviced service status -
Start Resource Manager services.
serviced service start Zenoss.resmgr
Connect the Analytics server
-
Log in to the Resource Manager browser interface as a user with Manager privileges.
-
Create a new user named
analytics_etland assign Manager privileges to the account.The Analytics server extracts performance data by making calls to the QueryService API, and this user account is dedicated to the purpose.
-
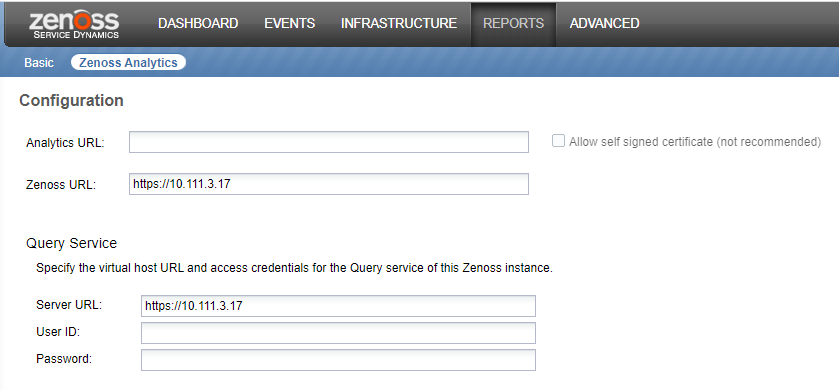
Navigate to Reports > Zenoss Analytics.
-
In the Analtyics URL field, add the IP address or fully qualified domain name of the Analytics server host, including the SSL port number (443).
-
In the Query Service area, enter the credentials of the
analytics_etluser. -
At the bottom of the page, click Save.
Resource Manager displays a message flare indicating success or failure.
-
Log in to the Control Center browser interface, and then restart the zenmodeletl, zeneventetl, and zenperfetl services.
SSL certificates are strictly verified
If you enabled SSL on the Analytics host and are not using a publicly recognized certificate, then you will need to install the root certificate of the CA into the Resource Manager image.
Have the root certificate in PEM format in your local directory then:
-
Start a Zope shell:
serviced service shell -i -s addRootCertificate zope bash -
Navigate to the CA directory and create the certificate pem file:
cp /mnt/pwd/<certificate>.pem /etc/pki/ca-trust/source/anchors/ -
Update the certificate store (do not do by hand and please note there's no output):
update-ca-trust extract -
Exit the container and commit the snapshot:
serviced snapshot commit fixAnalyticsCert -
Delete the resulting snapshot tag (the output of the previous command):
serviced snapshot rm <tag> -
Restart Resource Manager services.
serviced service restart Zenoss.resmgr
Verify installation and ETL operation
Installation success should be immediately verified as follows. If any of the verification steps fail, refer to the Analytics configuration documentation for specific troubleshooting procedures:
-
Log in to the Resource Manager browser interface, and then open REPORTING > Zenoss Analytics.
-
Click Add Batch, and then verify that the MODEL EVENTS options are listed in the Extractor drop-down list.
This confirms that the extractor daemons have successfully registered with the Analytics server and that therefore the Analytics server will automatically schedule work for them on an ongoing basis.
-
Wait until at least midday local time on the day AFTER installation before proceeding with this step. This gives Analytics time to have scheduled and executed MODEL, EVENT, and PERFORMANCE extracts for each collector and to have aggregated that data which is necessary before any out-of-the-box data analytics capabilities in Analytics will show data. Then verify the following:
- That all batches with an end time of within 15 mins prior to the current time are marked "COMPLETED".
-
Log in to Resource Manager using the test user account created in verification step 1 above. Navigate to Reporting > Advanced in the Resource Manager UI and then View > Repository in the Analytics UI. Verify that executing the following reports with a date range of "DAY-1" to "DAY-1" returns some data.
- Zenoss > Current Reports > Event Reports > Events by Class Report
Perform initial performance data ETL configuration
Since monitoring templates are a function of the ZenPacks that provide them, the default set of aliases provided for any particular ZenPack is a function of what is provided by that ZenPack. Details of default aliases provided by a particular ZenPack are provided in the "Zenoss Analytics" section of the webpage for that ZenPack on ZenPack catalog.
Where it exists, such default supplied configuration should be thought of as definitive documentation of a fully comprehensive set of ETL configuration for all the data points monitored by that ZenPack and this ETL configuration will evolve with future ZenPack development. Thus, it is likely significant overkill to ETL all such data points to your Analytics data warehouse without any actual requirement for reporting on them. Doing so is likely to add more ETL load and use a lot of disk space on the Analytics server, which makes managing Analytics much harder than it would otherwise be.
The following procedure should be run immediately after initial install and repeated after every ZenPack upgrade or Resource Manager upgrade to re-audit the ETL configuration so that it is not inadvertently changed as a result of such activities.
Enter the following on the Control Center master:
serviced service attach zope/0
su - zenoss
Use the zenalias script as follows to get your ETL configuration to an initial
known state with metrics for device-level CPU and memory usage, and
component-level filesystem and IP interface metrics ETL to Analytics.
This will allow out-of-the-box sample reports to execute successfully.
-
Dump out the current state of aliases in your install:
zenalias dump > original_aliases_$(date +%Y%m%d).txt -
Make a copy of the file and keep it somewhere safe for future reference:
scp original_aliases_$(date +%Y%m%d).txt myuser@myserver:/pathtosafeplace/ -
Use this file to remove ALL aliases currently in place:
zenalias remove -f original_aliases_$(date +%Y%m%d).txt 2>&1 \
  | tee removal_test.log
Check that this would remove all aliases successfully. The following grep should return no alias lines:
grep -iv "^-" removal_test.log | grep -v ControlCenterIf not, run
zenalias remove --helpto get information of what the error codes at the start of each line indicate.If successful, repeat with
--committo actually make the changes:zenalias remove -f original_aliases_$(date +%Y%m%d).txt --commit 2>&1 \ | tee aliases_removed_$(date +%Y%m%d).log -
Confirm this was successful, that is you now have no aliases at all:
zenalias dumpA file named aliases.txt with no contents should have been created. To check that no contents were created, execute the following grep command:
grep -v ControlCenter aliases.txt -
Create a desired subset of aliases from this file for the above mentioned device- and component-level metrics:
head -1 original_aliases_$(date +%Y%m%d).txt \ > current_aliases_$(date +%Y%m%d).txt grep -E "\|(cpu__pct|mem__pct|fs__pct|in__pct|out__pct)\|" \ original_aliases_$(date +%Y%m%d).txt \ >> current_aliases_$(date +%Y%m%d).txt -
Keep a copy of this file safe for future reference. It documents what your ETL configuration is always supposed to be. Zenoss highly recommends you put it under configuration management, and incrementally add to it over time as you add more data to the data warehouse to meet Analytics reporting needs.
-
Add these aliases to your monitoring templates:
zenalias add -f current_aliases_$(date +%Y%m%d).txt 2>&1 \
  | tee add_test.log
Check that this would add all aliases successfully. The following grep should return no alias lines:
grep -iv "^+" add_test.log | grep -v ControlCenterIf not, run
zenalias add --helpto get information of what the error codes at the start of each line indicate.If successful, repeat with
--committo actually make the changes:zenalias add -f current_aliases_$(date +%Y%m%d).txt --commit 2>&1 \ | tee aliases_added_$(date +%Y%m%d).log -
Confirm this was successful, that is you now only have exactly the aliases you added:
zenalias dump > aliases.txt
sort -u aliases.txt > a
sort -u current_aliases_$(date +%Y%m%d).txt > b
diff a b
The diff should show no differences between the two files.
Verify your ETL configuration
To verify that your ETL configuration is correct, log in to the reporting database directly and execute the following query:
select distinct metric_name from reporting.meta_metric order by metric_name;
The aliases you created will appear in the returned list after the next scheduled zenperfetl batch post aliases add has successfully completed for a collector that has devices monitored using the monitoring template that aliases have been added to.