Components
The Components view provides information about the different types of device components, including:
- IPService
- WinService
- IpRouteEntry
- IpInterface
- CPU
- FileSystem
To access components information, select Components in the left panel, and then select a component type. The components available will vary based on the type of device.
The status of each device component type, as shown by the color of its indicator, is determined by the collective status of the monitored components of the same type. For example, if the IpService status is green, then all monitored IpServices on the device are functioning normally. If there is an event related to a monitored IpService, then the highest severity event associated with that component is displayed.
Note
If there is an event unrelated to a known component, then the system places it in the component type Other.
From this view, you can:
- Lock components
- Turn on or off component monitoring
- Delete components
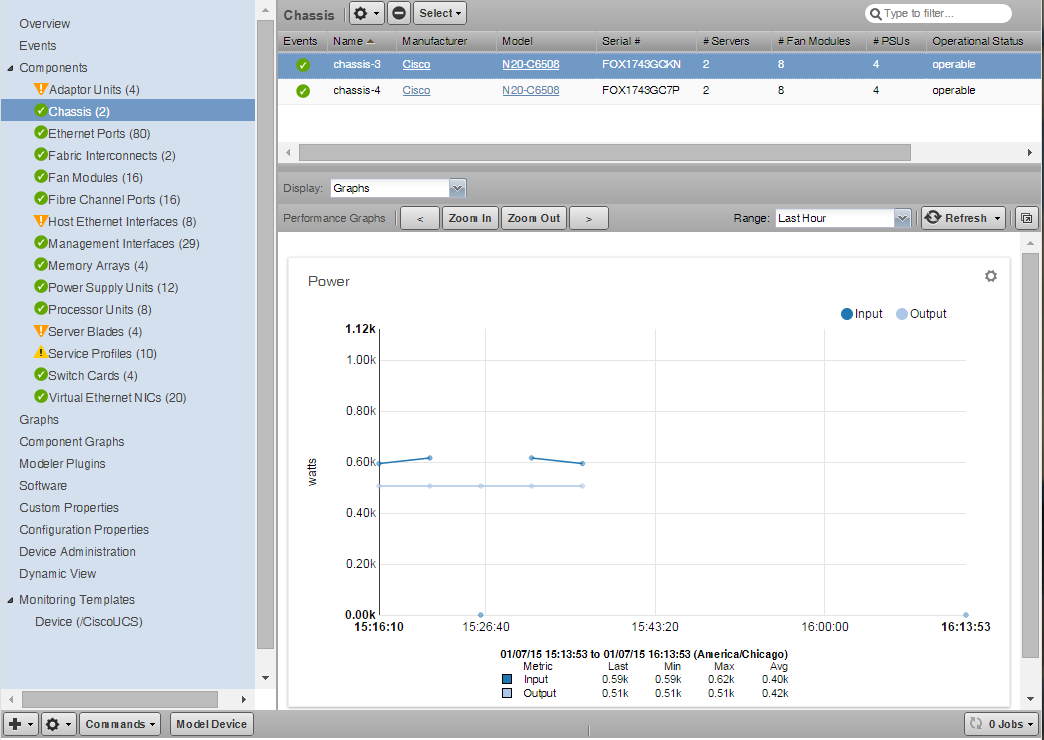
Component graphs
To access component graphs for a device, in the left panel, choose Component Graphs.
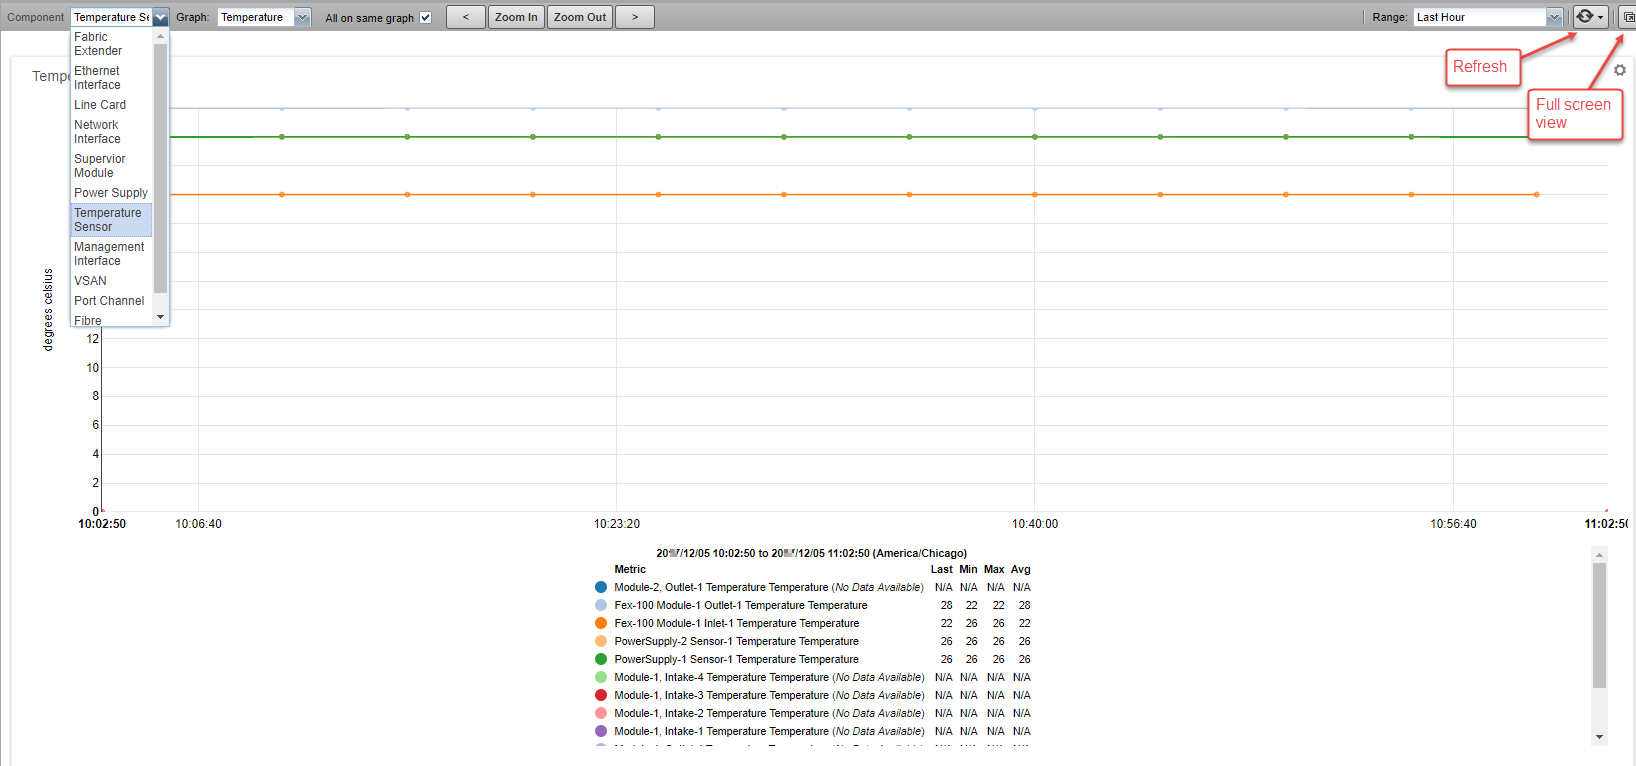
You can control the following component graph options:
| Option | Description |
|---|---|
| Component type | From the drop-down list, choose from the available components, based on the type of monitored device. |
| Graph type | From the drop-down list, choose from the available graphs, based on the selected component type. |
| Amount | Set this field to control the number of component graphs to view before pagination. If you use the All on same graph feature, this field will control the number of components displayed on the graph. The default value is 50. |
| All on same graph | Choose whether to display all metrics on one graph or to have a separate graph for each metric. |
| Zoom In/Zoom Out | Adjust the magnification of the view. |
| Center the graph | Click a point inside the graph to center the graph around the selected point.If other graphs are displayed in a view, they are also affected. |
| Scroll through time on the graph | Click the forward and back arrowheads. Using these controls automatically selects a custom time range. |
| Time range | From the drop-down list, choose from the available ranges. For a custom range, fields appear in which you can specify start and end dates and times. For the current date and time, choose Now. |
| Refresh | Click the button to manually refresh the graph(s) or choose a refresh interval from the drop-down list. |
| Expand | Expand the graph to a full screen view. |
Disabling component monitoring
There may be occasions when you want to stop monitoring certain components of your monitored resources.
To disable monitoring on one or more components:
-
On the Device overview page, select the component type.
-
In the Component list, select the components for which you want to disable monitoring.
-
Click the gear icon and choose Monitoring.
-
Click NO to disable monitoring.
You may want to clean up the Event log of any events that were created by these components prior to the disabling of monitoring.