Resource Manager Monitoring
Resource Manager provides self-monitoring capabilities. A visual pipeline-based status page in the browser interface shows an overview of the monitored Resource Manager instance, including key metrics for nodes in the metric collection, event generation, and modeling processes.
The following figure shows the Resource Manager status overview page.
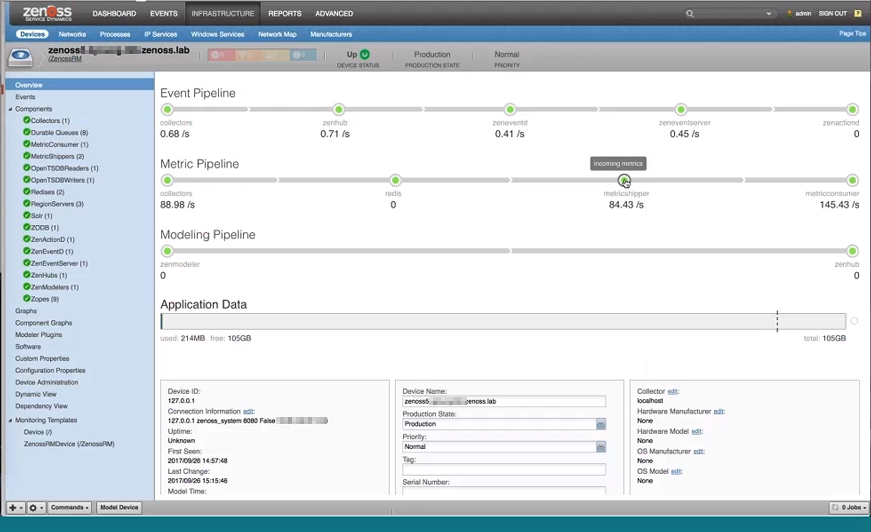
Resource Manager monitoring listens to events in the event class /ZenossRM. Each pipeline includes nodes and aggregate data for the associated components. Events on monitored components are used to flag a data pipeline node for your investigation. When a threshold violation occurs, the node changes from green to flashing gray, as shown by the metricshipper node in the figure. To open the detail page for the associated component, click a node in a pipeline.
Use data to troubleshoot performance issues with Resource Manager components and proactively manage performance. For example, data can help you determine when a component or service in the system is overloaded. Before issues occur, optimize system performance by adding more instances, more memory, more CPU, or adjusting configuration settings.
The Resource Manager installation or upgrade process creates device class /ZenossRM, and creates and models the local Resource Manager device with ID 127.0.0.1. Locally stored metrics for the monitored device provide detailed performance tracking for Resource Manager components.
You can add multiple Resource Manager instances as devices. Monitor the health and performance of multiple Resource Manager and Control Center instances from the same or another Resource Manager instance. You can monitor remote Resource Manager instances on the same Control Center and remote Resource Manager instances that are on a different Control Center.
Resource Manager self-monitoring
As above, the local Resource Manager should appear in the /ZenossRM device class as 127.0.0.1. No manual configuration should be required.
Resource Manager remote monitoring
To monitor a remote Resource Manager instance:
- From the Infrastructure > Devices page, click the "Add Devices" button and choose "Add a Single Device."
- Provide a device name that does not resolve in DNS. This will prevent IP conflicts if you are already monitoring the underlying Control Center or Linux device.
- Confirm the device class ("/ZenossRM") and the appropriate collector.
- Uncheck "model device," and click "Add."
- When the device lists in the Infrastructure view, click its name to be taken to the device overview page.
- Click "Configuration Properties" and populate the zProperties listed below with their appropriate values.
- Click the "Modeling" button at the bottom of the page, and choose "Model Device."
- Monitoring should commence automatically.
Resource Manager monitoring Configuration Properties
| Configuration Property | Description |
|---|---|
| zRMMonTenantHost | the vhost of the Resource Manager to monitor (zenoss5.yourrm.loc) |
| zRMMonTenantUser | the Resource Manager username |
| zRMMonTenantPassword | the Resource Manager password |
| zRMMonCCHost | the hostname or IP of the Control Center instance where the RM to monitor is running |
| zRMMonCCUser | the Control Center username |
| zRMMonCCPassword | the Control Center password |
ZenossRM components
Components of the /ZenossRM device are automatically discovered.
Attributes are updated on the normal remodeling interval, which defaults
to 12 hours.
You can add custom events and custom thresholds, and edit shipped thresholds for components that have them.
Shipped threshold values are subject to change in future releases. If you edit a value, your change will be overwritten by future updates.
Collectors
The aggregation of collector daemons and their supporting services grouped as localhost.
CollectorDaemons
The aggregation of statistics broken down by individual daemon service; for example, zenpython and zencommand.
Durable Queues
Persistent RabbitMQ message queues.
MetricConsumer
Pulls data from the Redis queue and passes it to MetricShipper.
This component ships with a default threshold. The maximum number of seconds that MetricConsumer needs to process its internal queue at the current rate is currently 300. If this value is exceeded, the MetricConsumer node on the metric pipeline turns gray and flashes.
Shipped threshold values are subject to change in future releases. If you edit a value, your change will be overwritten by future updates.
MetricShipper
Inserts metrics into OpenTSDBWriter.
This component ships with a default threshold. The maximum number of seconds MetricShipper needs to process its Redis queue at the current rate is 300. If this value is exceeded, the MetricShipper node on the metric pipeline turns gray and flashes.
Shipped threshold values are subject to change in future releases. If you edit a value, your change will be overwritten by future updates.
OpenTSDBReader
Allows queries to metric storage.
OpenTSDBWriter
Performs writes to metric storage.
Redis
Used as a cache for device configuration and metrics data.
RegionServer
OpenTSDBWriter uses this component for metric storage.
Solr
Provides the index of modeled devices and system objects.
ZODB
Object database that stores the model.
ZenActionD
Watches the event stream and sends configured notifications.
ZenEventD
Filters, enhances, and transforms events.
This component ships with a default threshold. The maximum number of seconds ZenEventD needs to process the rawevents queue at the current rate is 300. If this value is exceeded, the ZenEventD node on the metric pipeline turns gray and flashes.
Shipped threshold values are subject to change in future releases. If you edit a value, your change will be overwritten by future updates.
ZenEventServer
Performs event processing, storage, and retrieval.
This component ships with a default threshold. The maximum number of seconds ZenEventServer needs to process the zenevents queue at the current rate is 300. If this value is exceeded, the ZenEventServer node on the metric pipeline turns gray and flashes.
Shipped threshold values are subject to change in future releases. If you edit a value, your change will be overwritten by future updates.
ZenHub
The central coordinator of event generation and configuration delivery to daemons.
ZenModeler
Periodically scans modeled devices and saves attribute changes to the model.
Zope
Web server processes that serve the browser interface, reports, Zenoss JSON API requests, and debugging.
Customizing Resource Manager monitoring
Customize monitoring of Resource Manager components to fit your environment.
- Add and model one or more Resource Manager instances as
devices. For each device, specify the device class /ZenossRM, and
set configuration properties that have prefix
zRMM. -
To determine base-level performance for the Resource Manager instance, study component graphs after a week, a month, and so on. If a metric for a component captures data that indicates a potential problem, take the following actions:
-
- To the template for the affected component, add thresholds for the data point. - Create a threshold to send a warning level event that you can investigate. - Create another threshold to send an error level event to indicate a more serious problem.
- Create events with event class /ZenossRM for the threshold violations.
- As you collect more data, make adjustments to thresholds and events as needed.