Event consoles
Resource Manager features multiple event consoles that allow you to view and manage events. Each console shows different events subsets, depending on your current context.
- The master event console enables you to view and manage events. It displays the repository of all events that have been collected. To access this console, click EVENTS on the Navigation menu.
- Contextual event consoles are found throughout the system. Each time you see an Events selection for a device, device organizer, component, or event class, you can view event information that has been automatically filtered to show events specific to the current context.
Customizing
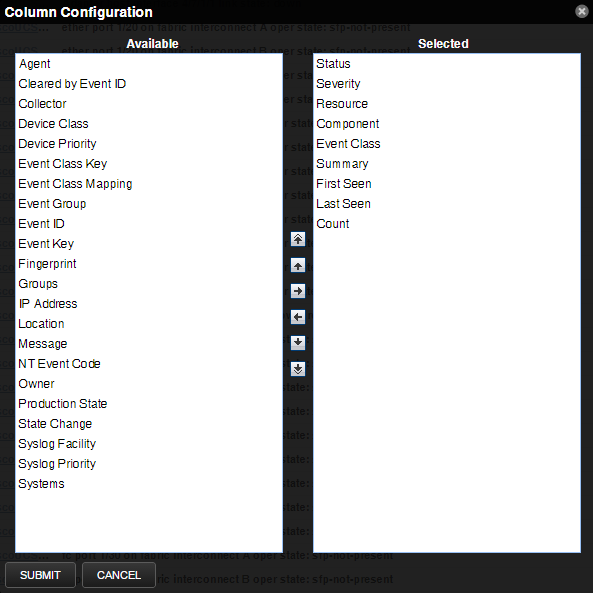
You can add or delete data columns to customize your event console view. The order of the selected column names determines the left-to-right display on the Event Console.
- Navigate to EVENTS > EVENT CONSOLE.
-
Click the Configure button and select Adjust columns from the drop-down list.
-
To select a column, double-click the name in the Available list to move it to the Selected list.
- In the Selected list, to re-order the columns, use the arrow keys.
- Click Submit.
Selecting events
To select one or more events in the event console, you can:
- Click a row to select a single event
- Ctrl-click rows to select multiple events, or Shift-click to select a range of events
Sorting and filtering events
You can sort and filter events by any column that appears in the master event console.
To sort events, click a column header. Clicking the header toggles between ascending and descending sort order. Alternatively, hover over a column header to display its control, and then select Sort Ascending or Sort Descending.
Filter options appear below each column header.
You can filter the events that appear in the list in several ways, depending on the field type. Date fields (such as First Seen and Last Seen) allow you to enter a value or use a date selection tool to limit the list. For other fields, such as Device, Component, and Event Class, enter a match value to limit the list.
The Count field allows you to filter the list when compared to a value. To search on count:
- N *- Displays events with a count equal to *N.
- :N *- Displays events with a count less than or equal to *N.
- M:N *- Displays events with a count between *M and N (inclusive).
- M: *- Displays events with a count greater than or equal to *M.
To clear filters, select Configure > Clear filters.
Working with live search
By default, Resource Manager uses a "live search" feature to help you locate information. From the event console, you can search for information by:
-
Device (name) and Component - Device name and Component searches:
- Are case-insensitive.
- Are tokenized on whitespace (meaning that any searches that span whitespace and do not start with a complete token will return no results).
- If quoted, return only exact matches.
-
Summary - Summary searches:
- Are case-insensitive.
- Are tokenized on whitespace (meaning that any searches that span whitespace and do not start with a complete token will return no results).
-
Event class - Event class searches:
- Are case-insensitive.
- Are tokenized on / (slash). If the search begins with a slash, and ends with a slash or asterisk, then event classes are searched by using a "starts with" approach. If a search starts with a slash and ends with any other character, then event classes are searched by using an exact match for the event class. If a search does not begin with a slash, then event classes are searched by using a sub-string match on each event class.
-
IP Address - IP address searches (for IPv4 and IPv6 values):
- Are tokenized by. (period) and: (colon). For example, the
following searches would return a result of 129.168.1.100:
- 168
- 168.1
- 129.16*
- *29
- Are tokenized by. (period) and: (colon). For example, the
following searches would return a result of 129.168.1.100:
-
Time fields
- First Seen - This is always the time of the first occurrence of the event and does not change.
- Last Seen - This is the most recent occurrence of the event, and is updated each time the event occurs.
- State Change - This is the time that the event state was modified, most commonly when the event is closed.
Entering a datetime in one of these filters formatted as YYYY-MM-DDHH:MM:SS displays events that have a timestamp that is equal to, or newer than, the input datetime. Note that while the input field accepts a 24-hour format, the system displays it in 12-hour format by default (using am/pm).
Additionally you can configure a time range to display events by using the following format 'startdatetime TO end datetime': "YYYY-MM-DD HH:MM:SS TO YYYY-MM-DDHH:MM:SS". An example might look like: "2017-07-21 12:00:00 TO 2017-07-22 12:00:00". This would include all events that the timestamp occurred within a 24 hour period between 12:00:00 on July 21st through 12:00:00 on July 22nd.
With live search enabled (the default behavior), the system filters available information immediately. It presents increasingly refined information with each character you type in the search window. When disabled, search responds only after you enter one or more characters and then press Enter.
Saving an event console view
Save a custom event console view by bookmarking it for quick access.
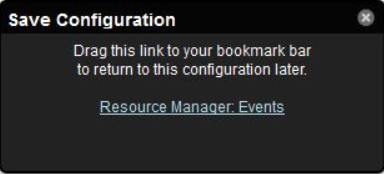
- Select Configure > Save this configuration.
- In the dialog box, select the link, and then drag it to the bookmarks area of the browser window. The browser adds a link to the bookmarks list.
- Change the title of the bookmark to distinguish this event console view.
Refreshing the view of events
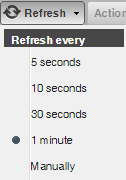
You can refresh the list of events manually or specify that they refresh automatically. To manually refresh the view, click Refresh. You can manually refresh at any time, even if you have an automatic refresh interval specified.
To set up automatic refresh, select one of the time increments from the Refresh list.
Viewing event details
You can view details for any event in the system.
-
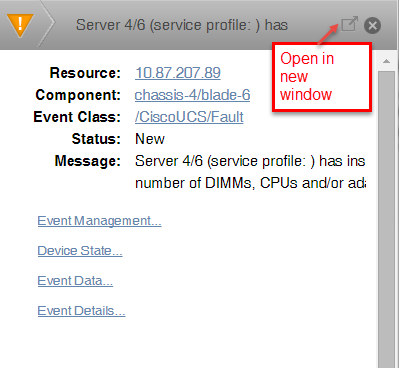
To view details, double-click an event row.
-
To display the event information in a new window, click the pop-out icon.
- To see more information about the event, click the link for Event Management, Device State, Event Data, or Event Details.
- In the log area, enter information about the event, and then click Add.
Acknowledging events
You may want to mark an event as "acknowledged" to indicate, for example, that you have taken action to remedy a problem. To mark events as acknowledged:
- Select one or more events in the event console view.
- Click the Acknowledge Events icon. A check mark appears for each acknowledged event.
Returning events to new status
Returning a previously acknowledged event to "new" status revokes its "acknowledged" status.
- Select one or more events in the event console view.
- Click the Unacknowledge Events icon. A check mark no longer appears in the event row, and the event is returned to "new" status.
Classifying events
Classifying events lets you associate events shown as /Unknown with a specific event class. To classify an unknown event, an event class key must be specified for the event.
- Select one or more /Unknown events in the event console view. You can also classify events from the event archive.
- Click the Reclassify an Event icon. The Classify Events dialog appears.
- Select an event class from the list of options, and then click Submit.
Closing events
When you no longer want to actively monitor an event (after you acknowledge it, for example), you can specify to close the event and move it to the event archive according to a configured event archive interval. To do this:
-
Select one or more events in the event console view.
-
Click the Close Events icon.The selected events are closed and moved to the archive at the specified interval.
To view events in the event archive, select EVENTS > Event Archive.
Note: Users with no assigned role can view all events in the archive.
-
Click the Refresh icon to update the event list. The closed events are removed from the display in the event console view.
Reopening events
You can reopen events in the active event console that are in the Closed, Cleared, or Aged state.
You cannot re-open a closed event if another active event with the same fingerprint exists. Before you can re-open the closed event, you must close the new event.
- Select one or more Closed, Cleared, or Aged events.
- Click the Reopen Events icon. The selected events are returned to active status.
Exporting event data
You can export data from the event console to a comma-separated value (.csv) or XML file. You can select individual events (to export only those events), or make no selections (to export all events that match the current filter criteria).
- Select one or more events.
- Select Export > CSV or Export > XML. By default, the exported file is named events.csv or events.xml.


