Impact View
The Impact View displays the interactive Service Impact graph of a service model and provides several views and tools.
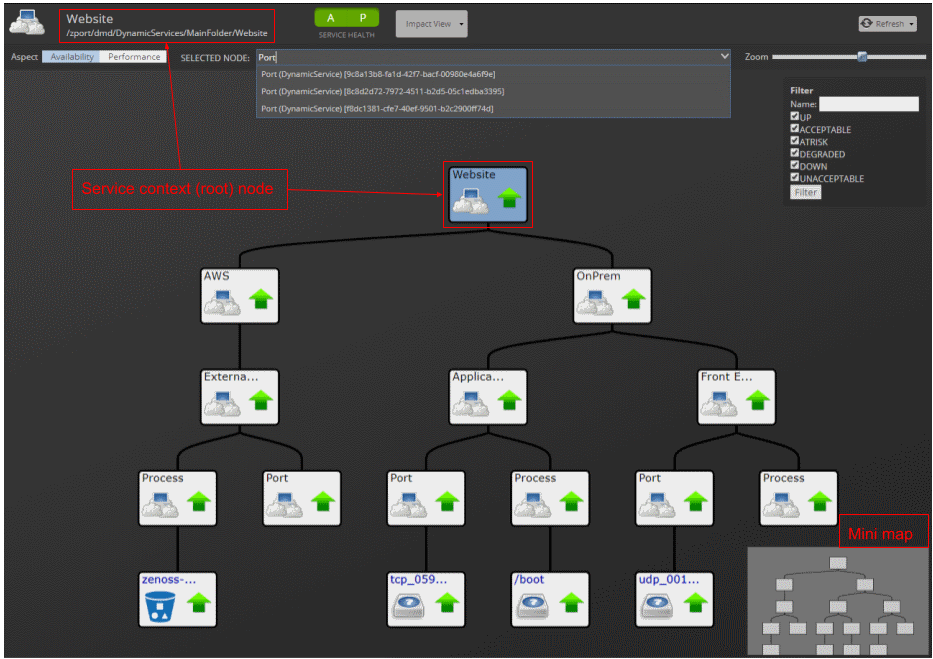
Service context (root) node name
In the upper left above the Aspect controls, the service context (root) node of the graph is displayed, along with its tree view path. Click the name to make the root node the selected node and display its name in the Selected node field.
Aspect views: Availability, Performance
Use aspect views to display and filter on availability or performance states in the graph.
Selected Node
Displays the name and type of the node that you have chosen, or the service context (root) node if you have not chosen a node. For example, DB Hosts (Organizing Group) is the node named DB Hosts, which is an organizing group type. When you first access the Impact View, the Selected Node field displays the root node. To resize the Selected Node field, hover the pointer to the left of the field label to display the resize tool, and then drag the tool left or right. When you choose a node from the list or click a tile in the graph, that node appears in Selected Node and the node tile is centered in the graph.
To search for specific nodes, begin typing a string in the Selected Node field. The field's drop-down list displays matching nodes in the following format:
node_name (node_type) [UID]
Tips for searching nodes:
- Strings are not case sensitive.
- Regular expressions are not supported.
- You can search for nodes by name, type, or system-generated unique identifier (UID).
-
To search for nodes by name only, suffix the search string with an open parenthesis. For example, the following string matches only node names that end with "Hosts," such as the DB Hosts node.
Hosts (However, the following string matches nodes with "hosts" in the name or type.
hosts -
To search for nodes by type only, prefix the search string with an open parenthesis. For example, the following string matches only node types beginning with "vSphere," such as the vSpherePnic type.
(vSphereHowever, the following string matches nodes with "vsphere" in the name or type.
vSphere -
To search for nodes that contain the same character string in the UID, prefix the search string with an open bracket. For example, the following string matches only nodes with a UID beginning with "G7M," such as G7M589.
[G7MHowever, the following string matches nodes with "G7M" in the name, type, or UID.G7M# Zoom
To increase or decrease the size of tiles in the graph, use the mouse wheel or drag the Zoom control in the upper right corner of the view.
Node tools
To see a summary of a node in a Service Impact graph, hover the pointer over its tile. Summary information includes the node name, availability state, performance status, production status, and type.
To display the following menu options for a node, position the pointer over it and right-click:
Toggle Children
Hide or display the node's child and descendent nodes.
Edit Impact Policies
Display the Impact Policies dialog box. See Impact Policies dialog box. Note, Impact Policies for Availability and Performance are set separately, depending on which aspect is selected.
Center view on node
Adjust the view so the selected node is in the center of the display area.
Graph and filter tools (right-click menu)
To display the following Impact View menu options, position the pointer in the primary view area and right-click.
Fit Graph to Window
Adjust the size of the graph so that its dimensions match the display area.
Show All
Display all nodes in the graph, including those that are automatically added by ZenPacks.
Collapse All
Display only the top-level node of the graph.
Compact View
Display only the service model members that you have manually added and the immediate children of a service or service group.
Toggle Rainbows
Display colored tabs at the right edge of the node, indicating the number of critical, error, and warning events associated with the node.
Show Filters
Hide or display the filter controls.
Use filter check boxes to select availability and performance states by which to filter. By default, all states are selected for filtering. To restrict displayed nodes to specific states, such as DOWN and UNACCEPTABLE, select only those check boxes. (Changes to the selected states apply to all dynamic services because state is a global feature.)
To filter by complete or partial node name, use the Name field. To perform the filter click Filter.
Export Graph Image
Creates a file of the graph image with the default name graph.png and downloads it to your workstation.
Enable center view
Shift the graph so that the selected node is in the center. The zoom level does not change. You can zoom in and out on the node in the center of the graph. Choose this option to recenter a specific node.
Jump to Selected
Shift the graph so that the node that is shown in the Selected Node field is in the center.
Jump to Context (root)
Shift the graph so that the service context (root) node of the graph is in the center.