Graphs (Performance)
The Graphs view shows performance graphs that are defined for the device or component. To access graphs, in the left panel, select Graphs.
You can control the following performance graph options:
- Time range controls - To narrow or expand the size of the time range, click Zoom In/Zoom Out. To scroll through time on the graph, click the forward and back arrowheads. Clicking these controls automatically puts you into a custom time range. You can also Zoom In and center around a graph point by clicking the point inside the graph. This will center the graph around the selected point. If there are other graphs displayed in a view, they will also be affected by any change to the range.
- Range - Select the span of time
that the graph displays. Depending on the range, data may
be downsampled.
By default, the behavior is to display an average per downsampled
point, but it can be changed on a per-graph basis (see below).
- Last Hour - This is the default view and no aggregation/downsampling occurs in this view.
- Last 24 Hours - Data is downsampled to 5-minute points.
- Last Week - Data is downsampled in 1-hour points.
- Last 30 days - Data is downsampled in 6-hour points.
- Last Year - Data is downsampled in 10-day points.
- Custom - Select the Start and End time to display. To set the end time to the current time, check Now. After changing a custom range setting, click Refresh to update the graph. Data displayed in this view may or may not be downsampled, depending on the range chosen.
- Refresh - To modify the refresh value (by default, 30 minutes), click the drop-down list. If you set the refresh rate to manual, click Refresh each time you want an updated graph.
- Pop-out - To render the current graphs in full-screen mode, click the icon in the upper right corner of the page.
- Downsample method - To set the downsample method, choose the
drop-down in the upper rigt corner of a graph. There are four
options:
- Min - the minimum value during the downsampled range
- Max - the maximum value during the downsampled range
- P95 - calculates the 95th percentile during the downsampled range
- Avg - (default) the average value during the downsampled range
-
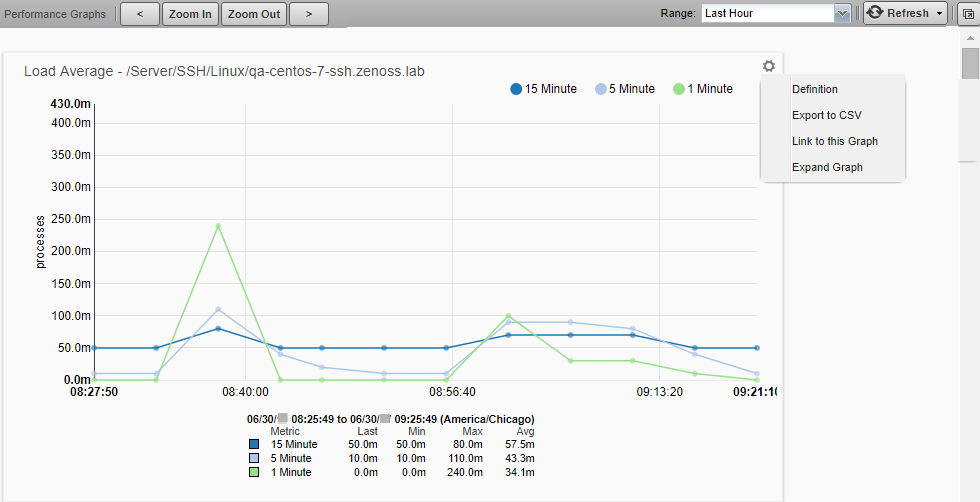
Action (gear) - To open a submenu of the following actions, click the icon in the upper right corner of the graph.
-
Definition - View the JSON definition.
-
Export to CSV - Export the datapoints as a .csv file for use in a spreadsheet. Only data contained in the defined range will be included.
-
Link to this Graph - Generate a link to this graph to save in browser bookmarks or use the URL to directly point to the graph in another Web page or dashboard. For example, to show the graph in the Dashboard, create a Site Window portlet and insert the URL to the graph.
If a graph has more than 28 graph points, you may receive an error stating "Unable to generate link, length is too great" when trying to link to it. This is a known limitation and no workaround exists.
-
Expand graph - Render the current graph in full-screen mode.
- Table Legend - To highlight a particular data set, hover the pointer over a legend description. To toggle the displayed legend description, click it. A solid dot indicates that data will be displayed. A hollow dot indicates data will be hidden.
-