Using the device interface
To view details for a single device, click its name in the device list. The device overview page appears.
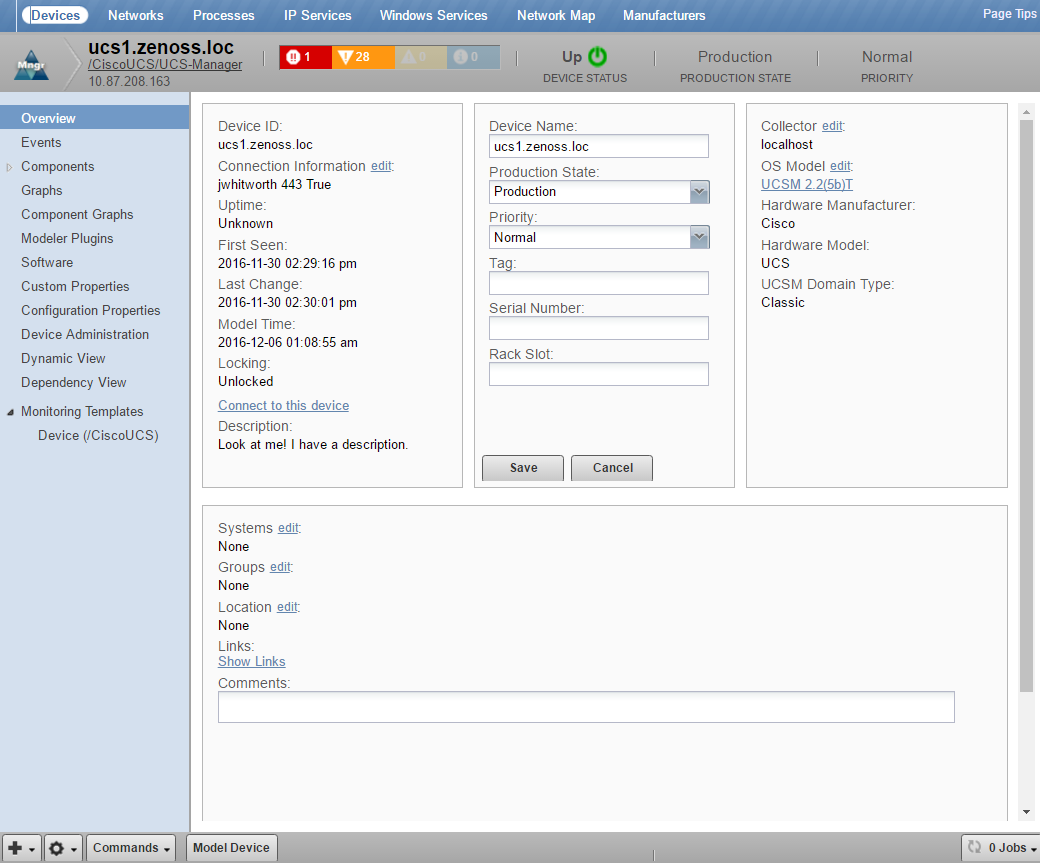
Event status is shown in the "event rainbow" at the top of the page. Other key information that appears at the top of the device overview page includes:
- Device name
- IP address used to communicate with the device
- Device status (shows the current results of a ping test)
- Production state (Pre-Production, Production, Test, Maintenance, or Decommissioned)
- Priority
When you open the page, device overview information displays. This view provides classification and status information. From here, you can edit device information (indicated by text fields or edit links). Editable fields include:
- Device Name
- Production State
- Priority
- Tag
- Serial Number
- Rack Slot
- Collector
- Hardware and software manufacturer and model
- Systems
- Groups
- Location
The Links area displays links between the device and other external systems. Click Show Links to view the links.
The left panel of the device overview page allows you to access other device managementviews, such as:
- Events
- Components
- Graphs (Performance)
- Component Graphs
- Modeler Plugins
- Software
- Custom Properties
- Configuration Properties
- Device Administration
- Dynamic View
- Dependency View
- Monitoring Templates
Information that appears here varies depending on device type.