Organizer Graphs
This reports shows graphical data about a specific organizer. The information varies depending on the type of organizer. For example, selecting /Devices/Network/Cisco as an organizer displays graphs on CPU and Memory Utilization, Throughput, Errors, and so on.
Report filtering
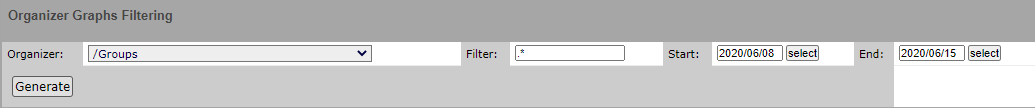
Organizer: The class to use for filtering. The default is /Groups.
Filter: Additional text filter to find graphs by name. The default is the
regular expression .* which returns all graphs available for the
selected organizer.
Start Date / End Date: The first and last dates of the range of dates to include in the report. To select a date from a calendar, click select. The default range is the week ending with the current date.
To generate or refresh the report, click Generate.