Interface and navigation
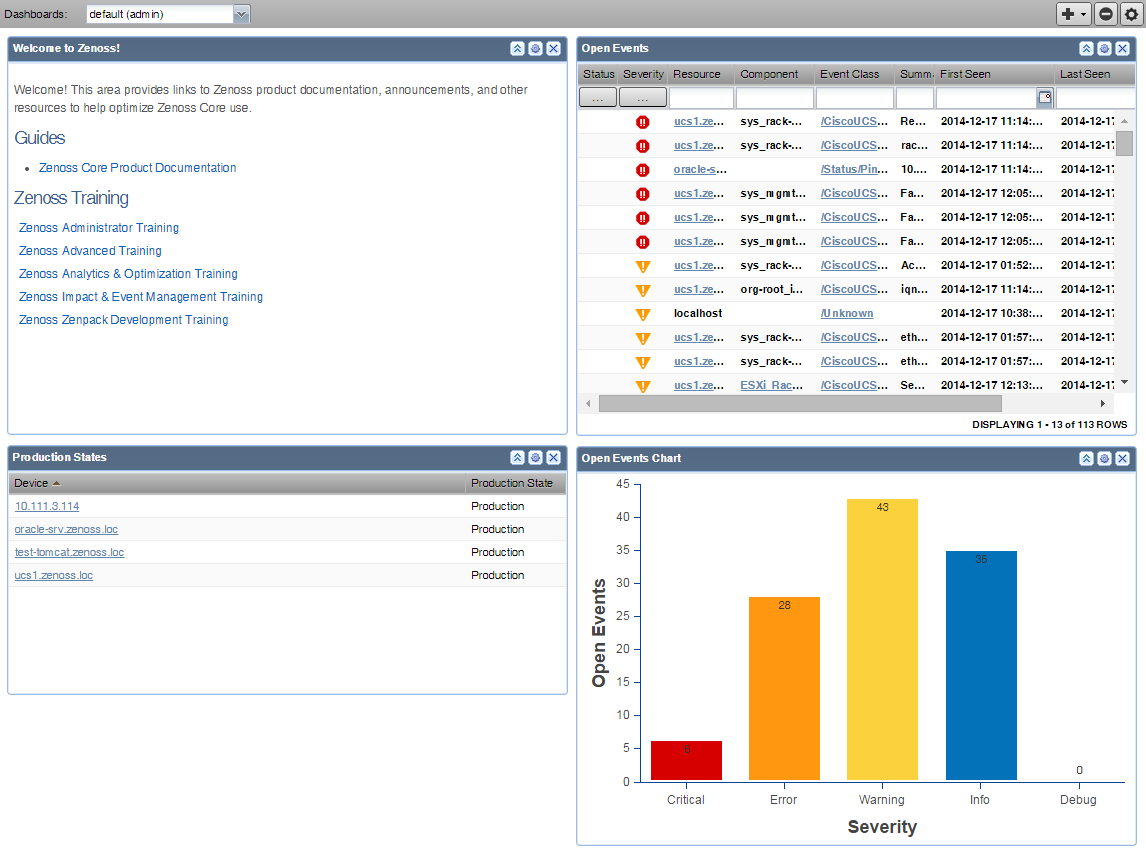
After you install the system and navigate to the interface from your Web browser, the Resource Manager dashboard appears. The Dashboard provides at-a-glance information about the status of your IT infrastructure. It is the primary window into devices and events that the system enables you to monitor.
For more information about the Resource Manager user interface, see Resource Manager interface reference.
The Resource Manager dashboard can be customized to display a variety of information including:
- System information resources and other Web pages, such as internal portal pages
- Important error-level device events
- Geographical high-level view
- "Troubled" devices
- Devices in a certain production state. You can also create additional dashboards that can be cloned from existing dashboards and can also be restricted to
- certainly users or user groups.
Key Resource Manager dashboard and interface areas include:
- Navigation menu
- User information area
- Portlets
- System Network Map
User information area
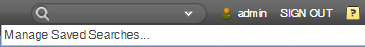
The user information area offers information and selections:
- Search - Search area to find information within the application. Click the down arrow in the search box to manage your saved searches.
- Login ID - The ID of the user currently logged in appears at the far left of this area. Click the ID to edit user settings, such as authentication information, roles, and groups. (You also can access user settings from the ADVANCED > Settings > Users page.)
- Sign Out - Click to log out of the system.
- Help icon - Click to access product documentation.