Control Center Monitoring
Resource Manager provides capabilities to monitor and manage the health and performance of Control Center resources.
The installation or upgrade process creates and configures the /ControlCenter device class for monitoring the local Control Center instance. You can add and monitor local and remote instances. Control Center must be running and listening on the target device's HTTPS port. To monitor a remote instance, you must provide the user name and password for that instance.
The modeler plugin is zenoss.ControlCenter. Modeling automatically discovers components of the /ControlCenter device. During normal remodeling intervals, the system updates component attributes. The system automatically generates data source types and monitoring templates for the /ControlCenter devices and device components.
Monitored Control Center resources include pools, hosts, services, running services, thin pools, and volumes. Graphs show memory usage, CPU usage, and page faults. Resource Manager generates events when a Control Center service fails or generates an error.
Pre-defined thresholds warn you and then issue an error when volume or thin pool space is low and extremely low. You can add custom events and thresholds, and edit shipped thresholds for components that have them.
Shipped threshold values are subject to change in future releases. If you edit a value, your change will be overwritten by future updates.
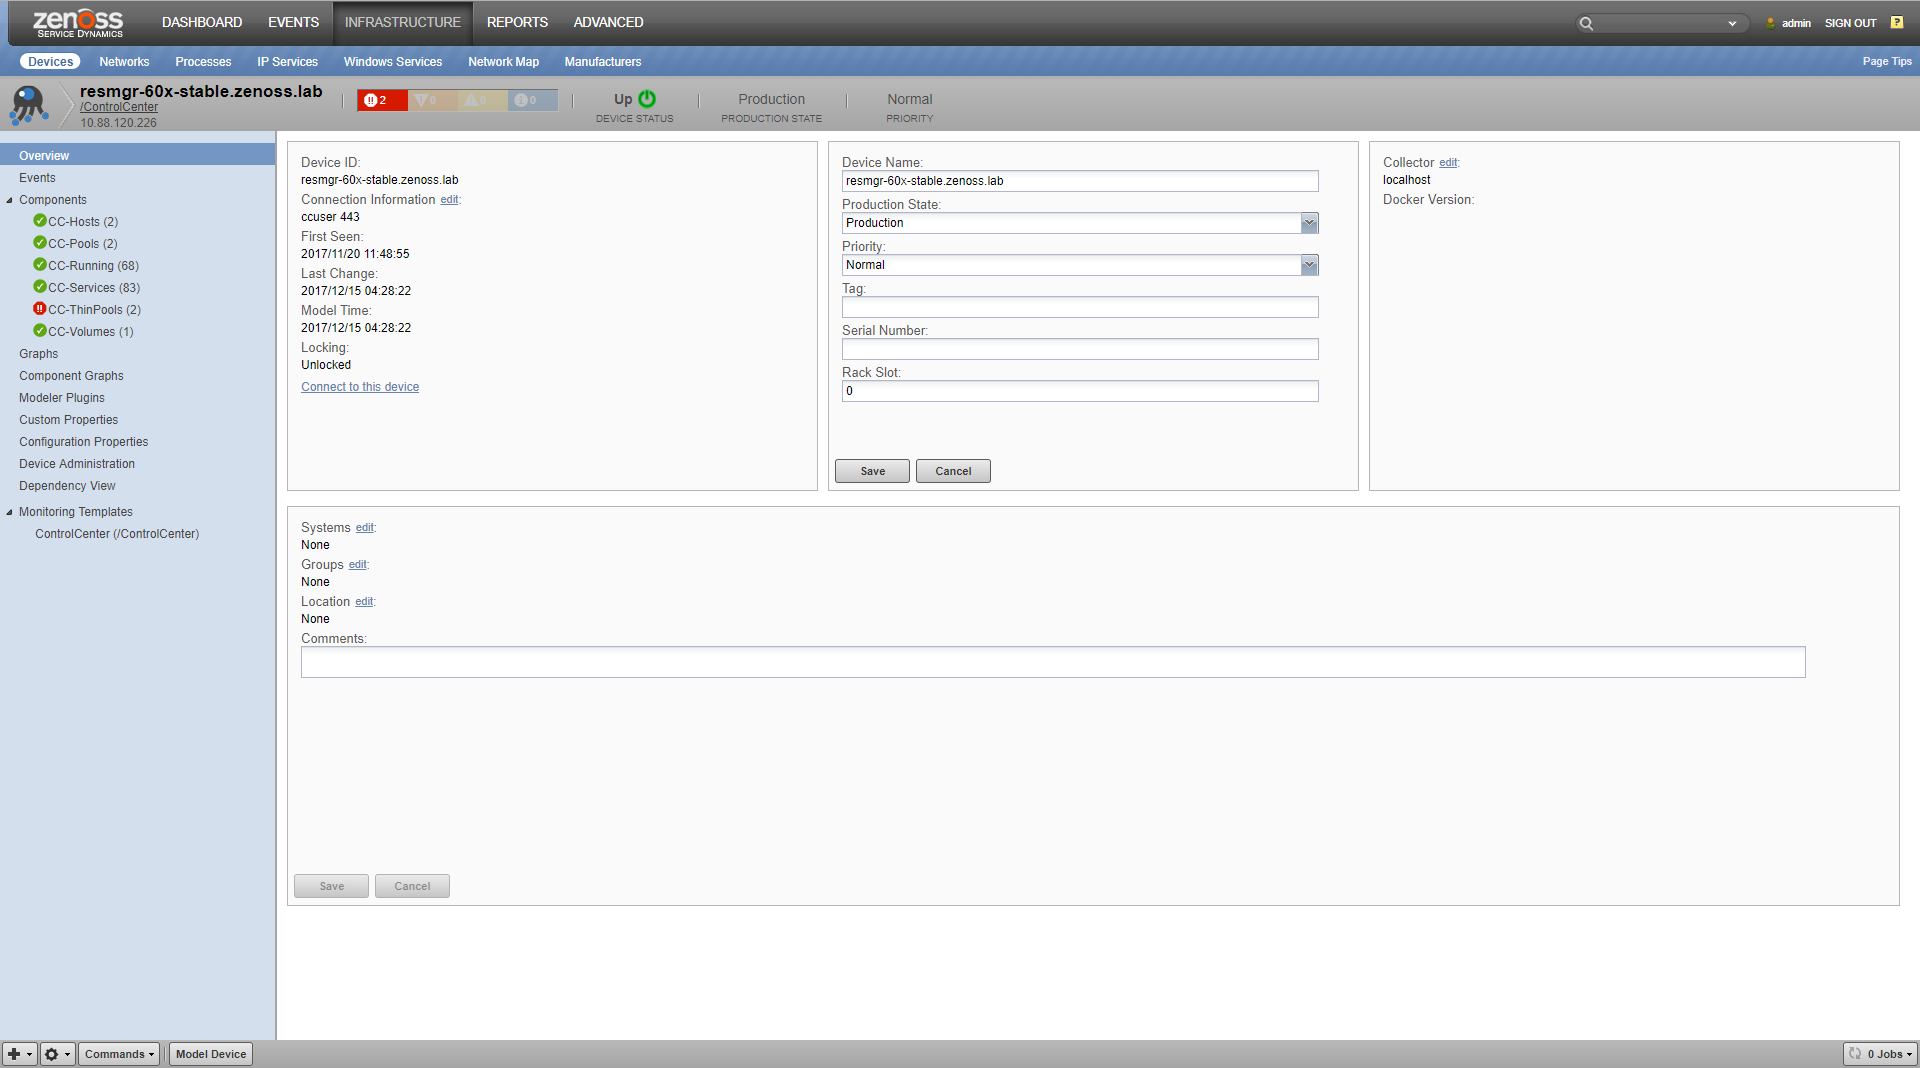
The following figure shows the overview page for the default Control Center device.
Control Center components
The /ControlCenter device includes the components in the following table.
| Name | Description | Attributes | Relationships |
|---|---|---|---|
| CC-Hosts | Host systems that run Resource Manager services. | CPU cores, IP address, memory | CC-Pools, CC-Running |
| CC-Pools | Resource pools that are associated with Resource Manager services. | CPU core capacity, memory capacity | CC-Hosts, CC-Services, CC-Running |
| CC-Running | Running instances of services that are defined in CC-Services. | Instances, status, service ID, parent service ID, host ID | CC-Pools, CC-Hosts, CC-Services |
| CC-Services | All services that are defined for your system to run on CC-Hosts. Service definitions specify service properties and states. |
Target state | Parent service, child services, CC-Pools, CC-Running |
| CC-Thin pools | LVM thin pools for Control Center application data. Thin pools include separate storage areas for data and metadata. |
Driver, driver type, pool name, total bytes, used bytes | None |
| CC-Volumes | Storage volumes for the /ControlCenter device. | Total bytes, used bytes, data file, driver, status | None |
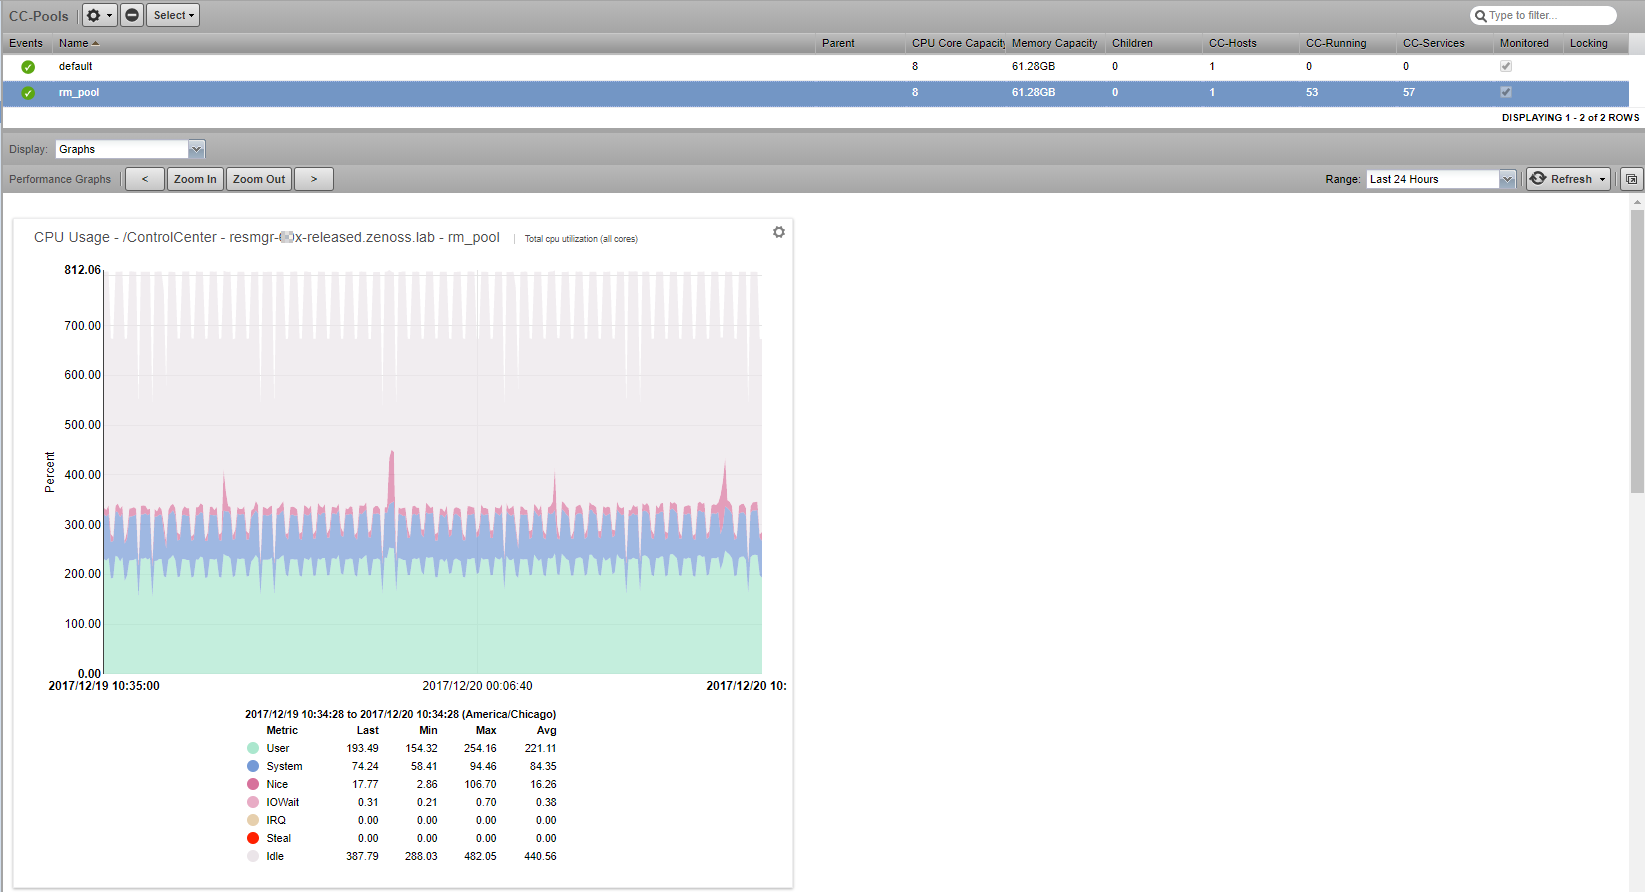
The following figure shows the CPU usage graph for the resource pool named rm_pool.
Customizing Control Center monitoring
Customize monitoring of Control Center health and performance to fit your environment.
- Add and model one or more Control Center instances as devices. For
each device, specify the device class /ControlCenter, and set
configuration properties that have prefix
zControlCenter. -
To determine base-level performance for the Control Center instance, study component graphs after a week, a month, and so on. If a metric for a component captures data that indicates a potential problem, take the following actions:
-
- To the template for the affected component, add thresholds for the data point. - Create a threshold to send a warning level event that you can investigate. - Create another threshold to send an error level event to indicate a more serious problem.
- Create events with event class /App/Zenoss for the threshold violations.
- As you collect more data, make adjustments to thresholds and events as needed.
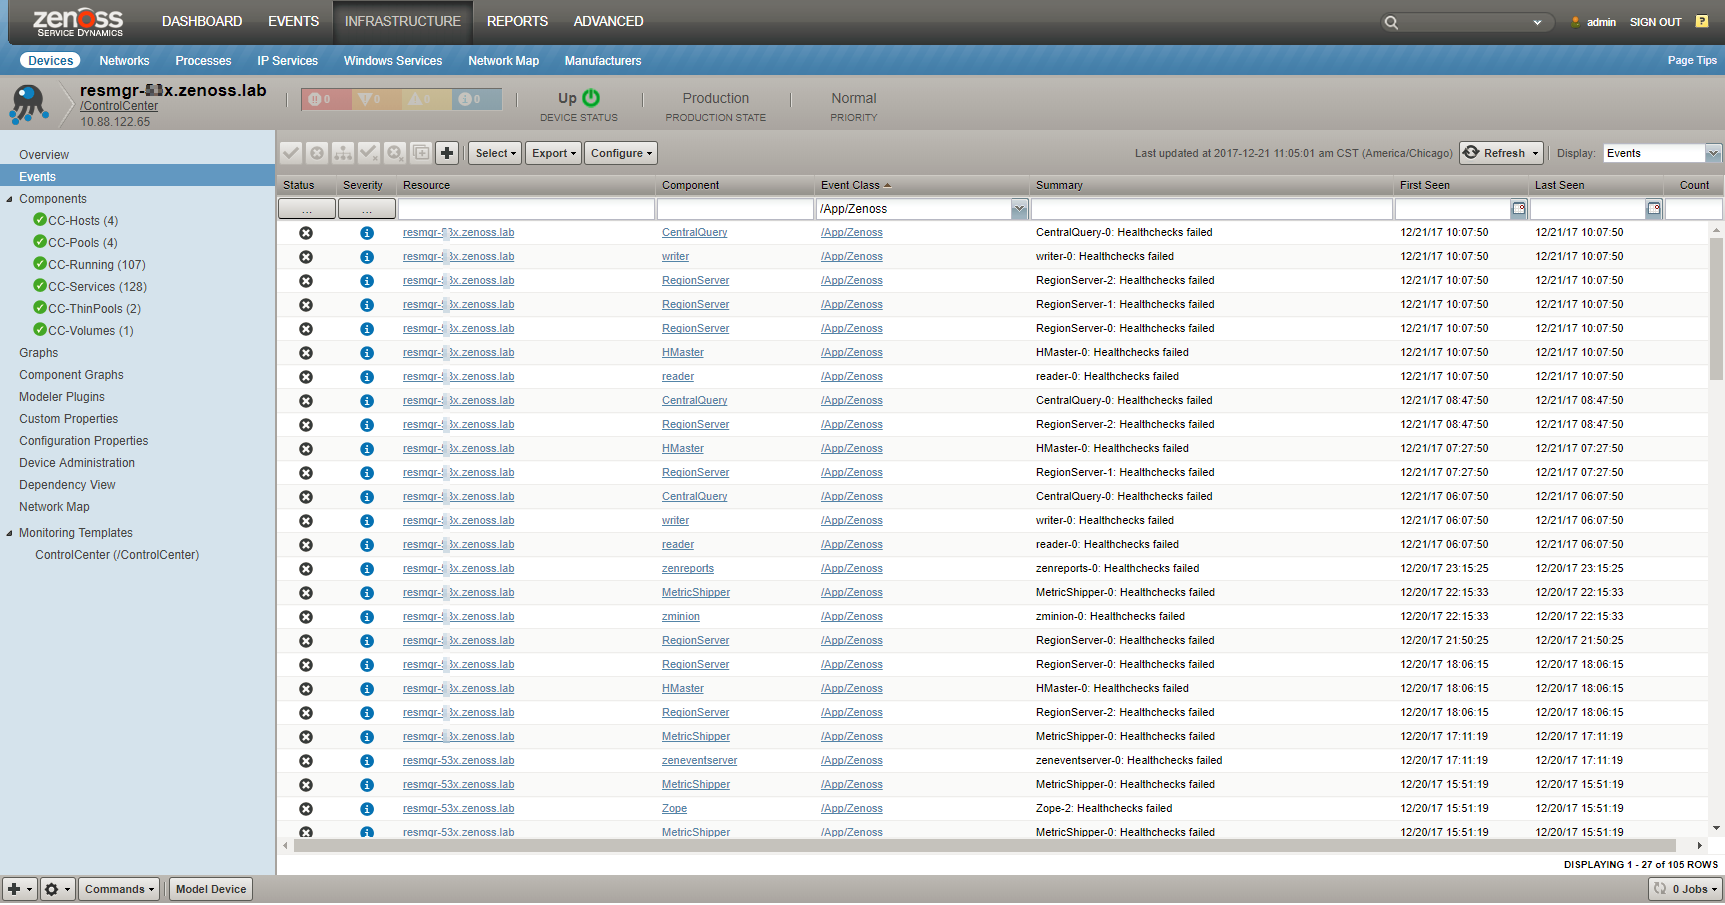
The following figure shows events for components of the default Control Center device.
Monitoring file system storage
Resource Manager monitors the Control Center application management and orchestration system and provides
- storage usage reports for the thin pool data and metadata devices
- usage statistics in the browser interface and the command-line
interface (
serviced volume statuscommand) - for DFS volumes and thin pool data and metadata devices, a "space low" warning event (80% full) and a "space very low" alarm (90% full)
Set up a notification so that Resource Manager alerts you to low storage events. For more information, see Triggers and notifications.