Performance data pipeline
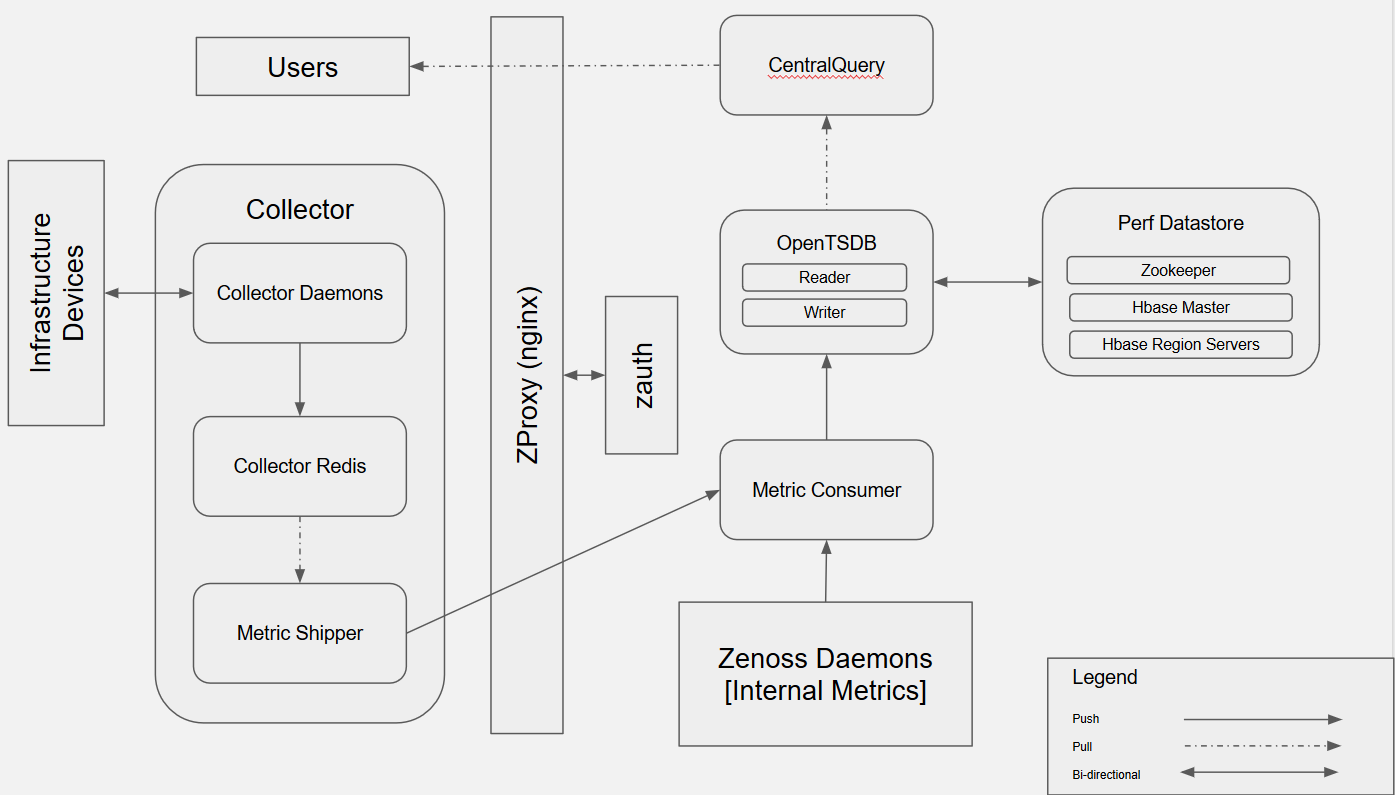
Performance Collection and Storage
Collector daemons gather metrics via their specific protocols
- Metrics are written as a collection of key-value pairs and tags in the
following format:
2017-02-15 19:45:39,225 DEBUG zen.MetricWriter: \ publishing metric 10.90.36.137/cpu_ssCpuSystemPerCpu \ 162450 1487187939 {'device': '10.90.36.137', \ 'contextUUID': '12d97430-f7bc-4073-91f8-6743d3ae94a1', \ 'key': 'Devices/10.90.36.137'} # Line breaks added for legibility - Included in the message are: device and datapoint, value, and timestamp
- Collected metrics are sent to CollectorRedis which acts as a queue.
- All collector daemons on a collector share a CollectorRedis instance.
- MetricShipper consumes from CollectorRedis and publishes to MetricConsumer
- Traffic is proxied through zproxy
- Authentication for zproxy is managed by zauth
- MetricConsumer acts as the aggregator for metrics from ALL collectors
- It then forwards metrics to the OpenTSDBWriter
- OpenTSDBWriter is responsible for actually writing the metrics to HBase
Performance Retrieval
- User interacts with RM UI through a Zope instance
- API request for performance data is made to CentralQuery
- Request is proxied through zproxy
- zproxy makes a request to zauth if the request doesn't have an authentication cookie
- Request includes device(s), component(s), datapoint(s), a range of timestamps, and (sometimes) a cookie
- Central Query forwards request to OpenTSDB Reader
- OpenTSDB Reader retrieves data from HBase
Performance Collection/Storage Troubleshooting
Sometimes performance collection can fail
- Check for events; they may point you to a failure
-
Verify credentials, connectivity, required target device configuration
-
Run collector daemon in debug mode
-
See if values are being collected
- If they are, check for failures to send data to redis
- If they're not, check for error messages that may indicate where it's failing
- If you're getting 500 errors, check zauth and see if it's overloaded; if it is, you may need to add more instances
-
Ensure performance data pipeline services are running and passing all health-checks
- Failing that, look at failing services' logs to identify the source of
the problem
- It's possible that you have some sort of data corruption or the service didn't start correctly for some reason; the logs should help you identify the source of the problem
Performance Retrieval Troubleshooting
Sometimes performance retrieval (graph rendering) can fail
- If you have a graphing failure localized to a single device, check its associated collector daemon
- If you have graphing failure localized to an entire remote collector, check CollectorRedis and MetricShipper
- Make sure that your graph configuration is valid
- Has it worked before?
- Is the problem with all graphs or one graph?
- Make sure values are being collected and stored
- You can check the OpenTSDB public endpoint directly for graph data
- Check health checks
- Failing that, look at failing services' logs to identify the source of the problem
- Make sure that zauth isn't overloaded
- Instances of zauth can be added to help distribute load